ViGIS (Vegetation Index Geographic Information System) is a satellite monitoring and support platform for agricultural fields throughout the entire life cycle of different crops. It is customised to the needs of Corteva Agriscience (Pioneer Hi-Bred Italia) technicians and customers, and has been in continuous development since 2016. ViGIS allows agronomists and farmers to assess crop growth and health and identify any critical issues, such as areas under greater stress that require priority intervention.
Platform features
ViGIS is a downstream service platform of the European Union’s Earth observation and monitoring programme called Copernicus, which uses information from a constellation of dedicated satellites called “Sentinels” and dozens of other satellites, known as “participating missions”.
ViGIS specifically uses data from the Sentinel-2 mission. The ViGIS platform can be used to map spectral indices for the study of the health of crops and cultivated fields, highlighting any specific critical issues and facilitating the intervention of agronomists on site. A spectral index is a combination of two or more spectral bands. Each spectral band contains reflectance information referring to a specific wavelength interval of the electromagnetic spectrum for each pixel of the image.
Product functionality
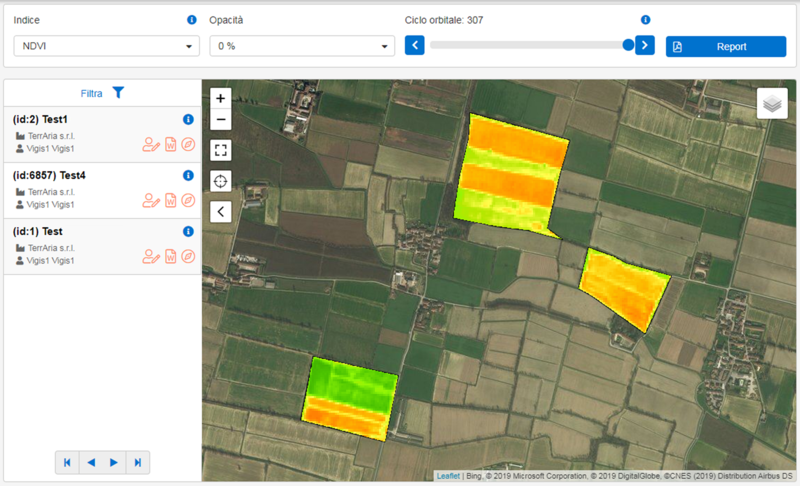
Each ViGIS user, once they have defined their areas of expertise, will be able to view vegetation vigour maps, based on various vegetation indices, including historical conditions, by modifying the reference orbital cycle. These maps can be queried by the user to find out the trend of the index at each point of interest throughout the growing season.
Reports are also available for these maps, showing statistics for each orbital cycle available in the specified time interval. Below is an example of the NDVI (Normalised Difference Vegetation Index) displayed on the fields of a system user. This index allows the presence and intensity of photosynthetic activity to be assessed. It is based on the ratio between the red bands, which are strongly absorbed by chlorophyll, and the near-infrared bands, which are reflected by the leaves to prevent overheating.
In addition, ViGIS offers the possibility of defining other spectral indices in addition to NDVI, such as NDWI (Normalised Difference Water Index), MSI (Moisture Stress Index) and NDRE (Normalised Difference Red Edge Index) in order to monitor soil moisture, plant water stress levels and plant nutritional status, respectively. For each spectral index, ViGIS makes it possible to query each pixel that makes up the field drawn, displaying its historical series.
The system updates automatically by downloading and processing any new images available from the Copernicus portal that meet the defined cloud cover requirements on a daily basis.
In addition to spectral indices, the ViGIS platform offers a wide range of features designed to provide advanced and accurate support for agronomic land management. These include the ability to use data from soil analyses to draw up detailed fertilisation plans that take into account not only the nutrients already present in the soil, but also the specific crop removals for each crop, as well as the quantity and quality of livestock effluent distributed on agricultural plots. Based on this information, ViGIS allows you to generate personalised fertilisation recommendations, which can be exported in a format compatible with variable rate fertiliser distribution systems, thus optimising agronomic inputs and improving the sustainability of the intervention.
The platform also allows you to create hybrid-specific maps for corn sowing, a useful tool for planning sowing based on the soil and production characteristics of different plots. To define the sowing plan, ViGIS provides two distinct algorithms, each based on a different agronomic approach. The first uses the NDVI vegetation index to generate recommendations based on the vigour of crops in previous seasons, while the second is based on data obtained from soil analysis, taking into account the physical and chemical characteristics of the soil.
Both approaches provide personalised agronomic advice tailored to the specific conditions of the plot, with the aim of optimising sowing and improving productivity. In this case too, the data can be exported in digital format, allowing variable rate sowing to be implemented with precision agricultural machinery, thus increasing the efficiency of the agronomic intervention. In addition to spectral indices, the ViGIS platform offers a wide range of features designed to provide advanced and precise support for agronomic land management.
These include the ability to use data from soil analysis to draw up detailed fertilisation plans that take into account not only the nutrients already present in the soil, but also the specific crop removals for each crop, as well as the quantity and quality of livestock manure distributed on agricultural plots. Based on this information, ViGIS allows you to generate personalised fertilisation recommendations, which can be exported in a format compatible with variable rate fertiliser distribution systems, thus optimising agronomic inputs and improving the sustainability of the intervention.
Another key feature offered by ViGIS is the preparation of sampling grids, which make it possible to accurately identify the optimal points for soil sampling. This systematic approach allows for the collection of representative and reliable data, which is essential for the subsequent chemical and physical analysis of the soil.
All the results of the soil analyses of the various samples can be consulted directly within the platform, ensuring quick and centralised access to essential agronomic information.
In addition, ViGIS allows the visualisation, interrogation and evaluation of yield and electrical conductivity maps of agricultural fields, which are indispensable tools for understanding the spatial variability of crop performance and for supporting increasingly targeted, efficient and sustainable agronomic decisions.
Discover how the ViGIS platform can help you monitor the life cycle of your crops!
Contact us for a personalised demo or for more information about the platform.
👉 You can access the Vigis brochure here
👉 Request a demo
👉 Write to us at: info@terraria.com