MASAI – Map for Damage Assessment with Satellite Artificial Intelligence is an advanced web platform developed by TerrAria within the MASAI project co-funded by the European Space Agency in response to the conflict in Ukraine.
The tool aims to provide practical support to operators engaged in humanitarian crisis, facilitating the assessment of infrastructure damage and buildings damage (residential, commercial, public…) through satellite technologies.
MASAI uses Synthetic Aperture Radar (SAR) satellite images and Very High Resolution (VHR) optical images to accurately analyse areas affected by wars or natural disasters.
The system was designed to respond to the operational needs of humanitarian organisations such as the Italian Red Cross Association, allowing rapid and accurate analysis of the structural and socio-economic conditions of damaged areas.
Among the main results provided:
- Level of infrastructure damage (3 levels: not damaged, moderately damaged, severely damaged/destroyed)
- Estimation of population affected
- Preliminary economic assessment of damage.
Key strenghts of MASAI
The added value of MASAI lies in its adaptability: the platform is effective not only in war scenarios but also in natural disasters, such as earthquakes or floods.
Thanks to its dual SAR and VHR technology, the system operates with two separate engines:
- SAR level (resolution 50-100 m): consists of screening by interferometric and coherence analysis of RADAR images (Sentinel-1, available free of charge), assessing the degree of infrastructure damage, even in the presence of cloud cover or low light
- VHR level (~50 cm resolution): uses high resolution imagery and Artificial Intelligence (AI) algorithms for change detection, offering a more detailed and integrated view of the humanitarian crisis, deepening the most affected areas identified with the SAR approach and containing economic costs. In addition to the damage, the VHR module provides information on the affected population and an initial estimate of the economic damage.
The platform was successfully tested on different areas in Ukraine, confirming the effectiveness of the model in managing real emergencies.
Main features of MASAI
MASAI is a modular WebGIS platform, developed with open-source technologies and easily accessible via browser.
MASAI offers a comprehensive set of tools for infrastructure damage analysis and humanitarian crisis management, including:
- Identification of affected areas in the crisis or post-conflict period by comparing pre- and post-event satellite images
- Assessment of damage to buildings and infrastructure on interactive maps
- Temporal monitoring of the evolution of the humanitarian crisis through successive images
- Estimation of the potential number of displaced persons in need of assistance and a rough assessment of the economic impact
- Georeferenced reporting through the inclusion of notes, images and comments on points of interest for real-time updates.
How does MASAI work?
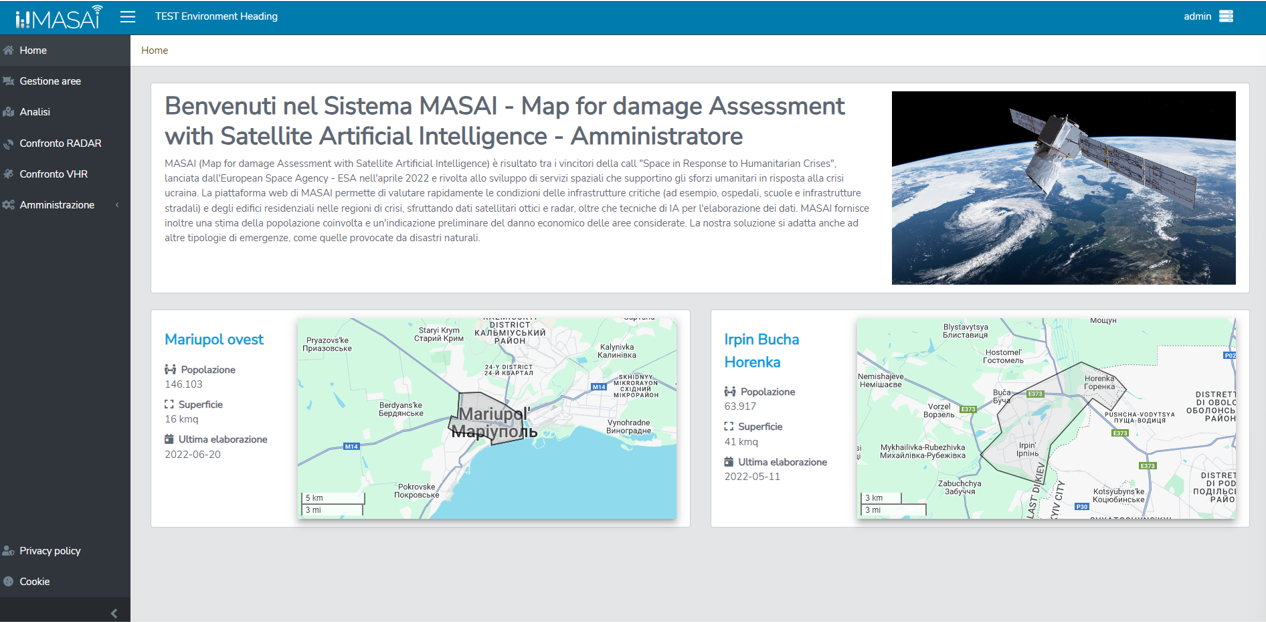
By accessing the MASAI service through authentication, the user accesses an interactive dashboard that provides an overview of the areas analysed and available in the system (figure below).
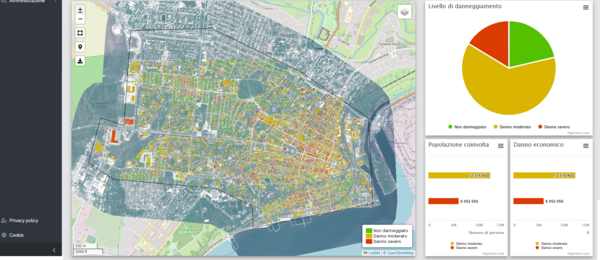
The analysis section (figure below) allows users to explore and interrogate geographical maps based on available dates and technology (SAR/VHR), with summary graphs relating to:
- Damage level
- Population affected
- Economic damage.
The application reasons both in terms of individual buildings and on a grid.
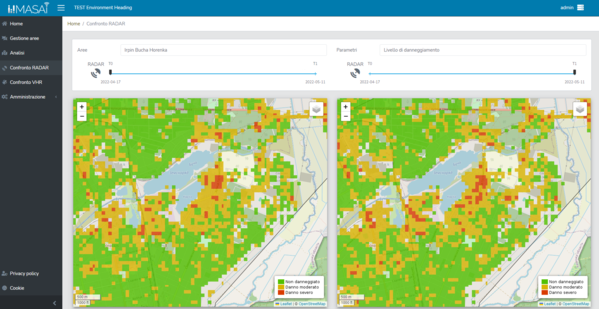
In the comparison section, it is possible to analyse the evolution of the humanitarian crisis by simultaneously displaying two synchronised maps relating to different time instants, making it possible, for example, to compare the current situation with the pre-event scenario or to assess the extent or reduction of the affected area between two different dates (figure below).
Are you interested in finding out how MASAI can support your fieldwork?
Contact us for a customised demo or for more information on the platform.
We are ready to help you turn satellite data and AI algorithms into fast, reliable and action-oriented decisions.
👉 Request a demo
👉 Email us at: info@terraria.com